Summary : Small-cap and large-cap stocks behave differently depending on economic cycles, investor sentiment, and Federal Reserve policy. While small caps offer faster growth and potential value upside, large caps provide resilience and stability during uncertain times. In 2025, investors are reassessing which segment offers stronger performance prospects as interest rates, inflation, and market leadership shift across U.S. equities.
Introduction: The Market Size Dilemma Every Investor Faces
Every investor eventually confronts the question: should I invest in small-cap or large-cap stocks?
This question isn’t just about company size — it’s about risk, growth potential, and timing.
Small-cap stocks (typically firms with market capitalizations between $300 million and $2 billion) represent innovation, domestic growth, and untapped potential. Large-cap stocks (those above $10 billion), on the other hand, are the corporate giants that anchor portfolios with stability and predictable earnings.
As we enter 2025, the debate between small caps and large caps has reignited. With the Federal Reserve signaling possible interest rate cuts and the economy finding balance after years of volatility, investors are watching closely:
Which segment will outperform in the coming cycle — small or large?
1. Understanding Market Capitalization: The Core Difference
What Does “Market Cap” Mean?
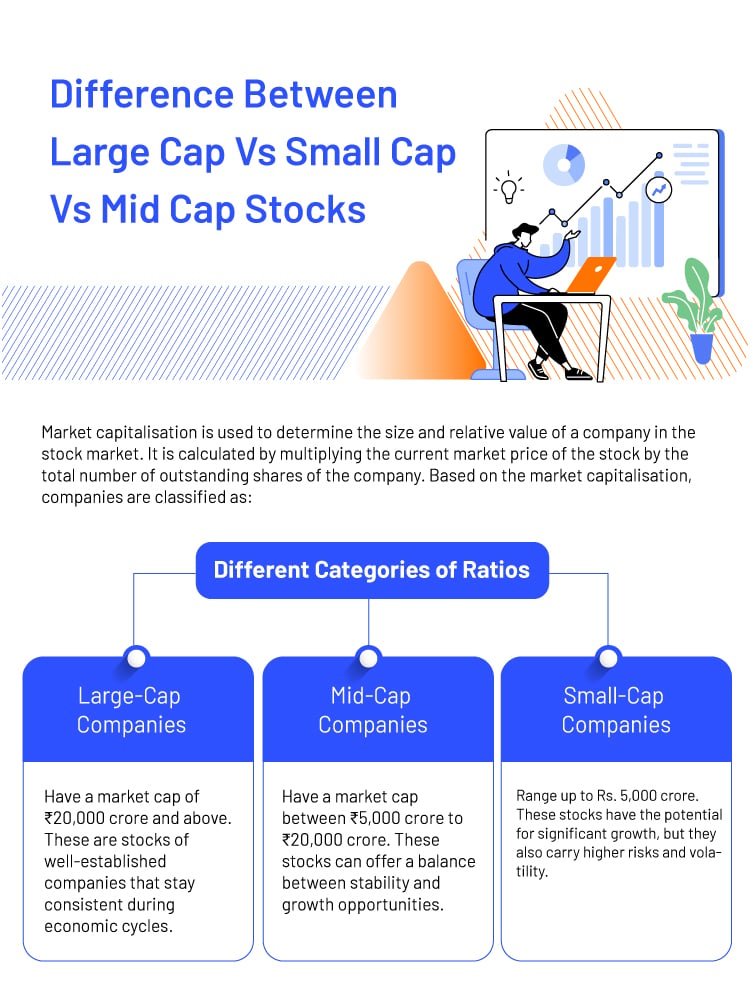
Market capitalization (or market cap) is the total value of a company’s outstanding shares. It’s calculated by multiplying the share price by the number of shares.
| Segment | Typical Range | Example Companies | Risk Level | Growth Potential |
|---|---|---|---|---|
| Small-Cap | $300M – $2B | Crocs, Planet Fitness, Roku | High | High |
| Mid-Cap | $2B – $10B | Chipotle, Carvana | Moderate | Moderate |
| Large-Cap | $10B+ | Apple, Microsoft, Coca-Cola | Low | Moderate |
While this looks simple on paper, each segment performs differently depending on the economic environment, interest rate policy, and market sentiment.
2. The Historical Battle: How Small and Large Caps Perform Over Time
A Look Back at Performance Patterns
Historically, small caps have outperformed large caps during economic recoveries, when credit conditions improve and investor optimism rises. Conversely, large caps shine during slowdowns or recessions, when investors seek stability and reliable earnings.
- Between 2003–2007, after the dot-com crash, the Russell 2000 Index (small-cap benchmark) outperformed the S&P 500 by over 40%.
- During 2008’s financial crisis, small caps fell nearly 35%, compared to large caps’ 25% decline — highlighting their higher volatility.
- In 2020, small caps surged as stimulus and rate cuts boosted risk appetite, with the Russell 2000 up 20% versus the S&P 500’s 14%.
- In 2022, when the Fed began aggressive rate hikes, small caps lagged — proving their sensitivity to interest rates.
Takeaway:
Small caps lead in expansionary phases; large caps dominate during contractionary ones.
3. The Role of the Federal Reserve: Small-Cap Sensitivity
The Federal Reserve’s monetary policy plays a huge role in determining which market segment thrives.
- When rates are high, borrowing becomes costly, hurting smaller companies that rely more on debt financing.
- When rates fall, small caps benefit more quickly, as they can access capital cheaply and expand faster.
As of late 2024 and into 2025, the Fed has hinted at potential rate cuts amid easing inflation. Historically, that shift supports a rotation into small caps, as investors look for undervalued growth opportunities.
Historically, the 12 months following the final Fed rate hike have seen small caps outperform large caps by an average of 14%.” — Morningstar Research, 2024
4. Valuations: Are Small Caps Undervalued in 2025?
Valuation metrics tell a compelling story.
- The forward P/E ratio for the Russell 2000 sits around 14x, compared to 21x for the S&P 500.
- The price-to-book (P/B) ratio for small caps is 1.7, versus 4.2 for large caps — a near-historic gap.
This means small caps are trading at a deep discount, offering potentially higher returns if the economy stabilizes.
Example:
In 2003, a similar valuation gap preceded a 70% rally in small-cap stocks over the next three years.
Takeaway:
If inflation continues easing and the Fed pivots, small caps may experience a valuation re-rating — especially in sectors like industrial, financial, and energy.
5. Growth Potential: Why Small Caps Appeal to Long-Term Investors
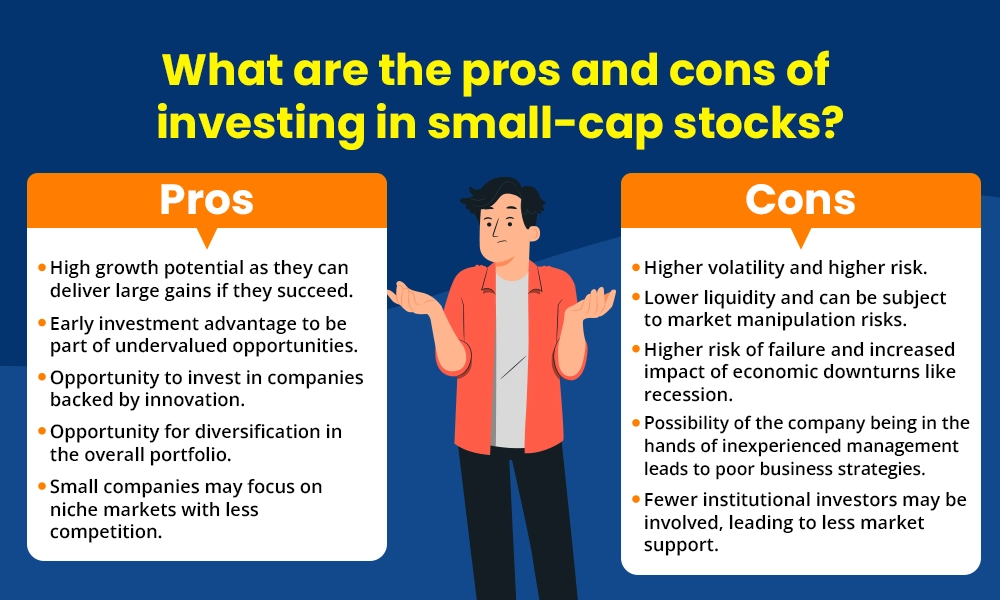
Small caps represent emerging companies often in niche markets or early growth phases. They innovate faster, adapt more quickly, and can multiply earnings from a smaller base.
Key Growth Drivers:
- Domestic focus: 75%+ of small-cap revenue comes from within the U.S.
- Technological innovation and market disruption.
- M&A (merger & acquisition) potential — larger firms often acquire smaller ones.
- Flexibility in adapting to new trends like clean energy, AI tools, and e-commerce logistics.
However, small caps are also riskier: higher debt ratios, limited cash flow, and sensitivity to downturns.
6. Large Caps: Strength in Stability
Large-cap companies dominate global markets, with diversified revenue streams and pricing power. They benefit from brand recognition, international exposure, and institutional investment.
During volatility, investors flock to large caps for:
- Dividend income (e.g., Coca-Cola, Johnson & Johnson).
- Liquidity (easier to buy/sell).
- Predictability in earnings and cash flow.
Example:
In 2022’s inflation spike, mega-cap tech (Apple, Microsoft, Nvidia) held strong compared to smaller peers. Their balance sheet resilience provided a safe haven for investors seeking reduced volatility.
7. Economic Cycles and Performance Trends
Let’s examine how each segment performs across economic phases:
| Cycle Stage | Economic Condition | Small-Cap Performance | Large-Cap Performance |
|---|---|---|---|
| Recession | Negative growth, high uncertainty | Weak | Strong (safe haven) |
| Recovery | Rising growth, low inflation | Strong | Moderate |
| Expansion | High demand, stable rates | Strong | Strong |
| Slowdown | High inflation, tight credit | Weak | Strong |
Currently, the U.S. economy sits between recovery and early expansion, suggesting that small caps could regain strength if the Fed eases policy and growth accelerates.
8. Interest Rates, Inflation, and Profit Margins
Higher interest rates compress margins for smaller companies that carry floating-rate debt.
Impact Breakdown:
- Small Caps: More sensitive due to higher leverage and limited pricing power.
- Large Caps: Better hedged with fixed-rate financing and global revenue streams.
If inflation stabilizes near 2.5% and rate cuts occur, margin recovery could drive small-cap earnings growth at twice the pace of large caps — a dynamic already seen in 2010 and 2016.
9. Sector Performance: Where Each Cap Type Excels
Different market segments dominate different industries.
| Sector | Favored Cap Type | Why |
|---|---|---|
| Technology | Large-Cap | Scale, global R&D, profitability (Apple, Microsoft) |
| Industrial | Small-Cap | Domestic growth, manufacturing rebound |
| Energy | Large-Cap | Capital intensity and pricing power |
| Consumer Discretionary | Small-Cap | Innovation, local demand |
| Healthcare | Large-Cap | Stability and global diversification |
| Financials | Small-Cap | Rate sensitivity and credit cycles |
In 2025, analysts from JPMorgan and Goldman Sachs have projected industrial small caps to outperform as U.S. reshoring and infrastructure spending accelerate.
10. Institutional Flows and Market Leadership
Large caps dominate institutional portfolios due to liquidity and index weighting. However, rotations occur cyclically:
- When growth slows, capital flows to mega caps.
- When expansion resumes, funds reallocate toward small caps seeking alpha.
ETF inflows in early 2025 show a mild shift toward Russell 2000 ETFs (IWM) after two years of outflows — a possible early signal of renewed interest in small-cap exposure.
11. Volatility and Risk-Adjusted Returns
Volatility is both a risk and an opportunity.
Small caps tend to have higher beta values (1.2–1.5) versus large caps (~0.9). This means:
- They fall harder during downturns.
- They rebound faster during recoveries.
Over a 20-year horizon, risk-adjusted returns between small and large caps are surprisingly similar — but small caps reward patient, long-term investors who can handle short-term swings.
12. Investor Psychology and Market Sentiment
Investor perception drives price momentum.
When investors fear recession, they sell small caps first. When optimism returns, they chase small-cap growth stories.
For example, after the COVID-19 dip, small caps gained 110% between March 2020 and December 2021 — a mirror of shifting sentiment once fear gave way to recovery optimism.
13. Portfolio Strategy: Blending Small and Large Caps
A balanced portfolio should include both segments to manage risk and capture growth.
Suggested Allocation (Moderate Risk Profile):
- Large Caps: 60% (core holdings, dividend payers, defensive)
- Small Caps: 30% (growth exposure, domestic opportunities)
- Mid Caps / Other Assets: 10%
Tactical Moves:
- Overweight small caps during early expansions.
- Rotate to large caps during tightening cycles or recessions.
- Rebalance quarterly to capture valuation gaps.
14. Case Studies: Learning from Market History
Case 1 – The Post-GFC Recovery (2009–2013)
Fed stimulus and low rates led to a 150% surge in small caps as investors hunted for growth.
Case 2 – The Inflation Era (2021–2023)
Aggressive tightening favored large caps and dividend-heavy sectors; small caps underperformed by 20%.
Case 3 – The 2025 Transition Period
With inflation cooling and potential rate cuts ahead, history suggests small caps could reclaim leadership, especially in manufacturing and services sectors.
15. The 2025 Outlook: Data-Driven Predictions
Analyst Consensus
- Goldman Sachs: Projects small caps to outperform by ~12% in the 12 months post-final Fed cut.
- Morningstar: Sees small caps as “deeply undervalued” relative to historical norms.
- Morgan Stanley: Predicts a “multi-quarter small-cap rotation” as liquidity improves.
Quantitative Indicators
- P/E discount: ~35% vs. large caps.
- EPS growth forecast: +15% (small) vs. +8% (large).
- Dividend yield: 1.5% (small) vs. 1.9% (large).
These metrics collectively indicate a potential small-cap resurgence — if macroeconomic tailwinds align.
16. Practical Advice for Retail Investors
To capitalize on this shift:
Do:
- Invest via ETFs (e.g., IWM, VB, or SLY for small caps).
- Diversify across sectors to reduce single-stock volatility.
- Rebalance exposure quarterly.
Avoid:
- Over-concentrating in speculative small caps with weak balance sheets.
- Ignoring liquidity — exit risk is higher in thinly traded small-cap names.
17. The Behavioral Edge: Staying Rational Amid Cycles
One of the biggest mistakes investors make is chasing trends late.
By the time small caps outperform headlines, much of the rally has often occurred. Early positioning based on data and Fed outlook offers a better risk-reward balance.
Successful investors like Peter Lynch and Joel Greenblatt built fortunes spotting value early in smaller companies before Wall Street’s spotlight found them.
18. Frequently Asked Questions
1. What defines a small-cap vs. large-cap stock?
A small-cap stock refers to a company with a total market capitalization typically ranging between $300 million and $2 billion. These firms are often in early growth stages or focused on niche markets. A large-cap stock, by contrast, usually exceeds $10 billion in market value and includes well-established, globally recognized firms such as Apple, Microsoft, and Johnson & Johnson. The distinction is important because company size affects liquidity, volatility, and long-term growth potential.
2. Which performs better in recessions — small caps or large caps?
During economic recessions, large-cap stocks usually outperform because they have stronger balance sheets, more cash reserves, and diversified revenue streams across global markets. Small caps, on the other hand, often depend heavily on domestic demand and may struggle when credit conditions tighten. Investors seeking stability and dividend income tend to prefer large caps in downturns. However, once recovery begins, small caps often lead the rebound as risk appetite returns.
3. Why do small caps outperform after interest rate cuts?
Small-cap stocks are more sensitive to changes in monetary policy because they rely on affordable borrowing to fund growth and expansion. When the Federal Reserve lowers interest rates, financing costs drop, credit availability improves, and investor confidence rises — all of which benefit smaller companies disproportionately. Historical data shows that in the 12 months following the final Fed rate hike, small caps have outperformed large caps by an average of 10–15%, according to Morningstar and Goldman Sachs research.
4. Are small caps inherently riskier investments?
Yes, small caps generally carry higher volatility and greater risk due to their smaller size, limited financial reserves, and concentrated business models. These companies may experience sharp price swings, especially during market uncertainty. However, they also provide higher long-term growth potential, making them appealing to investors who can tolerate short-term fluctuations. Proper diversification and selective stock picking can help mitigate risks while capturing upside opportunities.
5. What’s the best small-cap index to track performance?
The Russell 2000 Index is the most widely recognized benchmark for tracking small-cap performance in the United States. It includes roughly 2,000 smaller publicly traded companies, covering diverse sectors like industrials, consumer discretionary, and healthcare. Many small-cap ETFs, such as iShares Russell 2000 ETF (IWM) or Vanguard Small-Cap ETF (VB), use this index as their underlying benchmark, offering investors broad exposure to this high-growth segment of the market.
6. Should investors hold both small and large caps in their portfolio?
Absolutely. A balanced portfolio containing both small-cap and large-cap stocks helps diversify risk and capture returns across market cycles. Large caps provide consistency, dividends, and downside protection, while small caps add growth and agility. Historically, portfolios that blend both have delivered superior risk-adjusted returns over time. Investors can use ETFs or index funds to maintain proper allocation and rebalance periodically as market conditions shift.
7. How does inflation impact small-cap companies?
Inflation can have a more severe impact on small-cap firms because they typically lack the pricing power of larger corporations. Rising input costs—such as raw materials, wages, and logistics—can quickly erode profit margins. Larger companies often offset these pressures through global operations and cost efficiencies. However, if inflation stabilizes while growth remains positive, small caps can benefit from improved earnings momentum and investor rotation into undervalued, domestically focused stocks.
8. Are large caps overvalued in 2025 compared to small caps?
Many analysts believe that large-cap stocks remain richly valued as of 2025, especially within the technology sector. The S&P 500 trades at a higher forward P/E ratio (~21x) compared to the Russell 2000 (~14x). This valuation gap suggests small caps may be underappreciated. If interest rates decline and economic growth strengthens, small caps could outperform as investors rotate away from overvalued mega-cap names toward more attractively priced opportunities.
9. Which sectors are leading the small-cap recovery in 2025?
Sectors such as industrials, regional banking, energy, and healthcare innovation are driving the small-cap rebound in 2025. Domestic infrastructure spending, reshoring of manufacturing, and AI-driven productivity trends have created fresh growth opportunities for smaller U.S. firms. Additionally, many small financial institutions benefit from stabilizing interest margins as rate hikes pause. These dynamics position small caps to capture early-cycle growth before large caps catch up.
10. What’s the ideal entry strategy for investing in small caps?
Investors should consider a gradual entry strategy through dollar-cost averaging — investing a fixed amount at regular intervals rather than timing the market. This approach smooths out volatility and helps accumulate shares during both highs and lows. Using diversified ETFs or mutual funds can reduce company-specific risk. For active investors, focusing on small caps with strong fundamentals, positive cash flow, and manageable debt levels can offer higher returns during the next market expansion phase.
11. How can I measure whether small caps are undervalued or overvalued?
The best way to assess small-cap valuations is by comparing metrics such as the price-to-earnings (P/E), price-to-book (P/B), and price-to-sales (P/S) ratios with historical averages and large-cap benchmarks. As of early 2025, small caps are trading at a 30–35% discount to large caps — near multi-decade lows. Analysts interpret this as a signal that small caps are undervalued, especially if interest rates continue to trend lower and earnings growth rebounds.
12. Are small-cap stocks suitable for long-term retirement portfolios?
Yes, when allocated appropriately, small-cap stocks can play a vital role in retirement portfolios by boosting overall growth potential. Although they introduce higher short-term risk, their compounding power over decades can significantly enhance portfolio performance. Many retirement-focused investors maintain 10–25% exposure to small caps, balancing it with large-cap and fixed-income assets. The key is patience — staying invested through cycles rather than reacting to short-term volatility.
13. How can investors reduce the risk of small-cap investing?
Risk management in small-cap investing starts with diversification — spreading exposure across multiple industries and companies. Using small-cap ETFs instead of individual stocks minimizes concentration risk. Additionally, favoring companies with solid fundamentals, strong cash flow, and low debt can protect against downturns. Maintaining a long-term horizon and avoiding emotional decision-making during volatility further enhances success in this high-potential segment.
14. What’s the correlation between small-cap stocks and U.S. economic growth?
Small-cap performance is highly correlated with U.S. domestic growth, as these companies generate most of their revenue from within the country. When GDP expands, consumer spending increases, and credit conditions improve, small caps thrive. Conversely, during economic slowdowns, their earnings can contract faster. Monitoring indicators like the ISM Manufacturing Index and consumer confidence data can help predict small-cap market trends.
15. How does market liquidity differ between small and large caps?
Large-cap stocks enjoy deep liquidity because they attract institutional investors and are heavily traded daily, resulting in tight bid-ask spreads. Small-cap stocks, however, often experience lower trading volumes, which can lead to wider spreads and price gaps during volatility. While this makes them riskier in short-term trading, it also means well-timed entries can yield outsized returns when sentiment improves.
Conclusion: The Market Balance Between Growth and Security
The small-cap versus large-cap debate has no permanent winner — it evolves with the economy.
In 2025, small caps are undervalued, rate-sensitive, and positioned for growth as policy turns accommodative. Large caps remain dependable, global, and dividend-rich anchors for risk management.
The smartest investors won’t pick one side — they’ll balance both, timing exposure based on macro signals and Fed direction.
In a world where money follows confidence, the stronger segment is the one you understand best and can hold through volatility.
Read this also : https://fazi.world/regional-spotlight-a-market-analysis-of-the-southern-uss-booming-economy-and-investment-potential/